
Drone photogrammetry from photo to measurement
As a technical imaging specialist, I produce orthophotos and 3D models and illustrate your study reports. Here is how reliable measurements of a site are obtained from photographs taken by drone.
From survey to measurement, on a real survey
Loading the survey…
What is photogrammetry?
Photogrammetry is the technique of measuring an object or a piece of ground from photographs. A point seen in several images taken from different positions can be located in space by triangulation, just as our two eyes perceive depth.
The drone takes thousands of high-definition aerial photographs that overlap heavily. Photogrammetric processing combines them into a point cloud, a 3D model and then an orthophoto (or orthomosaic): an image of the ground surface, corrected for distortion and colour-balanced.
The same processing describes the surface as a point cloud: you know the position of every object, in planimetry (horizontal position) as well as in altimetry (height). You see the site as it is and measure distances, areas and volumes to within a few centimetres.
Photogrammetric processing: twelve steps, from photos to plan
-
01
Image capture
The drone follows a flight plan of parallel lines at a constant height (here 120 m). The photographs overlap heavily, along each line and from one line to the next, so that every point on the ground appears in many images. The drone is an RTK drone: it corrects the position of each shot in real time, with centimetre-level accuracy. On the ground, an RTK GNSS receiver on a tripod (rover) measures control points that check how the model is tied in. The result: fewer targets to lay out, less time on site, and surveys that are georeferenced from the start. For the area shown here, more than 700 photos taken at 120 m with a 1-inch, 20-megapixel sensor: about 3.3 cm per pixel on the ground.
-
02
Sparse point cloud
The software detects thousands of distinctive points shared by several images: the tie points. Matching them recovers the exact position and orientation of every shot. This is aerial triangulation, which produces a first, sparse cloud.
-
03
Dense point cloud
Once the images are oriented, the software matches them pixel by pixel and computes millions of points, each with its position (X, Y, Z) and colour. Nearly 27 million for the area shown here. The dense cloud is the basis for all measurements.
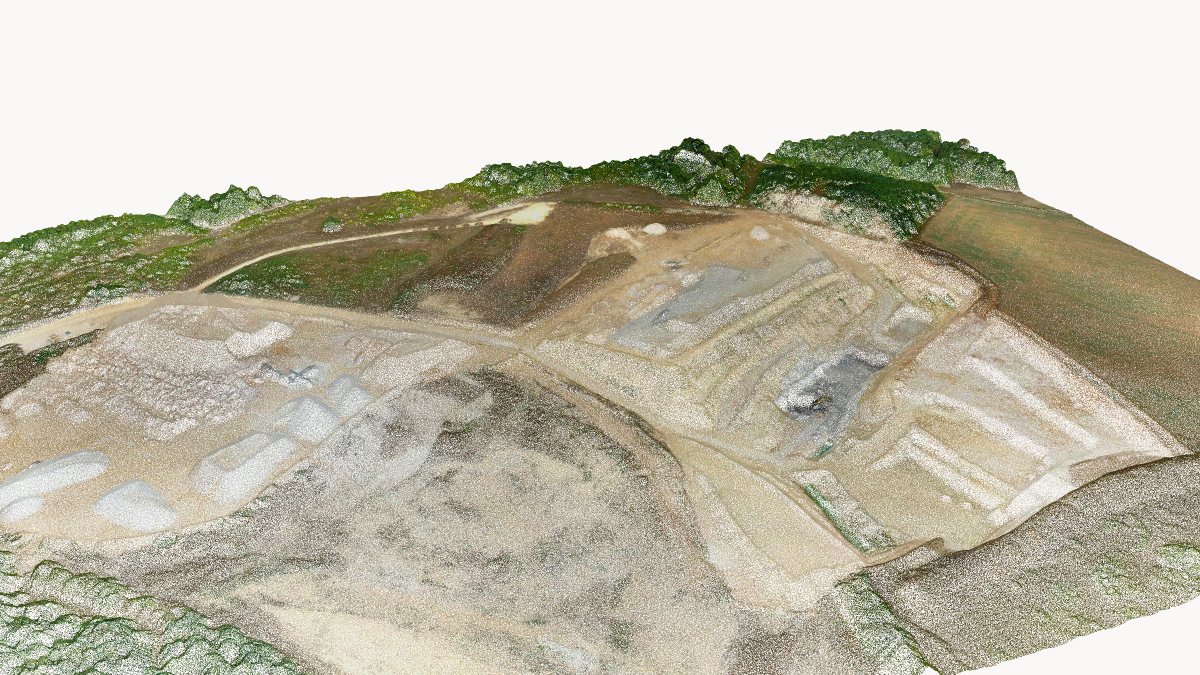
Dense point cloud: nearly 27 million points, each with its position and colour. -
04
Point classification
Each point is given a category: ground, tall or low vegetation, machinery and plant, stockpiles, water, haul roads… Classification separates the ground from what stands on it, and makes it possible to compute a bare-earth model (DTM) as well as the surface model (DSM).
-
05
3D mesh
The software joins the points into a network of triangles: the mesh. The cloud becomes a continuous surface on which slopes, profiles and volumes can be computed.
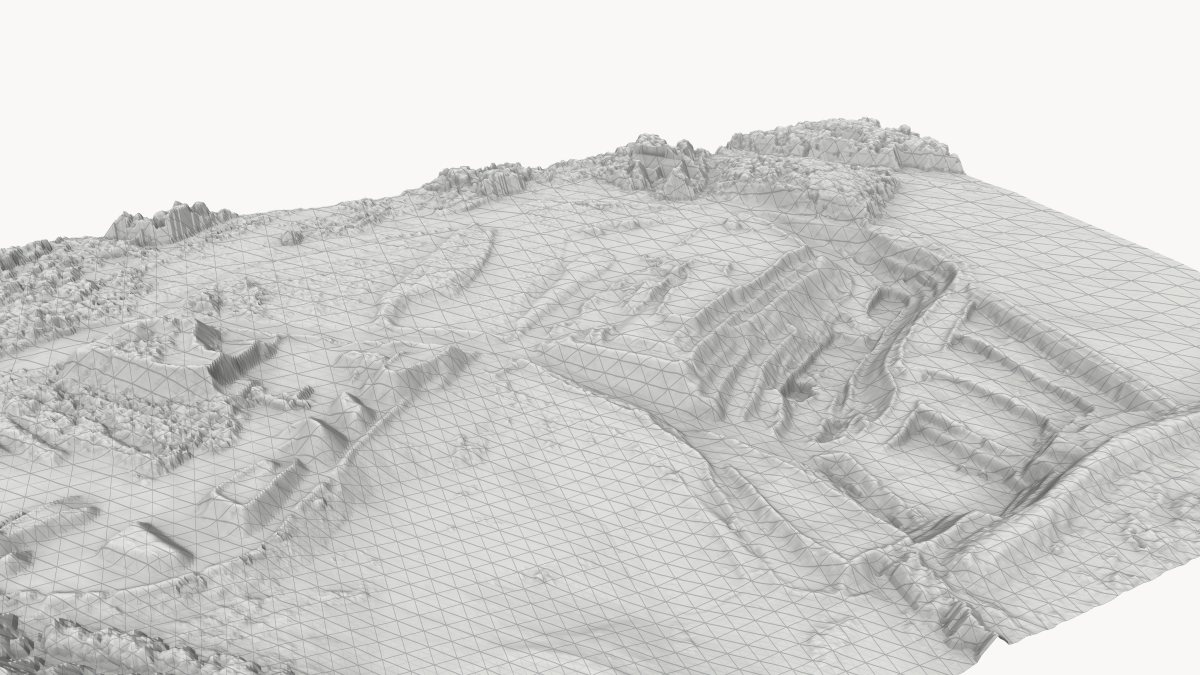
3D mesh: the continuous surface, before the photo texture. -
06
Textured 3D model
The software projects the photographs onto the mesh: the model shows the true appearance of the site and can be viewed from any angle. It is the basis of 3D models of terrain, buildings and heritage.
-
07
Shaded relief
The digital surface model gives the elevation at every point. Shaded and coloured by height, it brings out the relief: working faces, benches, bunds, stockpiles. I remove machinery and plant so that only the ground remains.
-
08
Slopes
The software computes the slope at every point of the actual ground and groups it into classes (0–5°, 5–15°, 15–30°, 30–45°, over 45°). It locates banks and working faces, for safety as well as for restoration.
-
09
Orthophoto
The software rectifies the photographs to remove perspective and relief distortion, then mosaics and colour-balances them into a single image. An orthophoto keeps the same scale everywhere: it overlays a plan or a GIS, and you measure on it as on a plan.
-
10
Measurements
Distances, areas and volumes are computed on the model: length of a haul road, area of a pit floor, volume of each stockpile. With regular monitoring, comparing two surveys shows what has changed: cut and fill, remaining reserves, quantities of stored material. With RTK georeferencing, two successive surveys line up to within a few centimetres: the difference measured between them is a real change in volume, not a misalignment.
-
11
Contour lines
The model produces contour lines, here every metre with index contours every 5 m: the classic way of reading relief on a plan.
-
12
Mapping
I bring together contours, tops and toes of slopes, haul roads, site boundary, stockpiles and volumes on a map, with title block, legend, scale and north arrow: site mapping, development or restoration plan, environmental mapping. Your land surveyor, or a partner surveyor, then checks and signs off the plans and data.
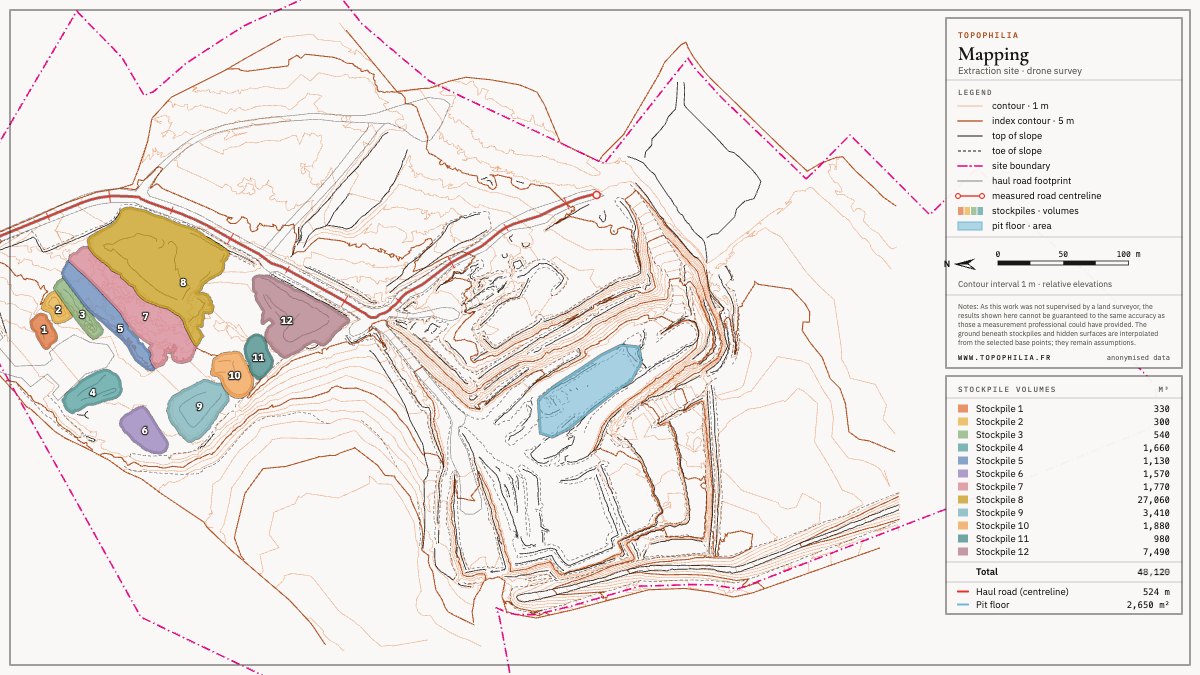
Mapping: contour lines, slopes, numbered stockpiles and volume table.
Your data, in the form you need
Plans, reports, files for your software… and above all an online space reserved for you, to view and analyse your surveys in complete confidentiality.
A dedicated, private and confidential viewer
Each client has their own online space, protected by an access code: map, measurements, stockpile volumes, plans and reports can be viewed and measured in the browser, with no software to install. Your surveys stay available from one campaign to the next, so you can follow how the site changes.
Mapping and reports
Site mapping, development and restoration plans, illustrated study reports: precise documents that decision-makers can understand. Your land surveyor, or a partner surveyor, signs off the plans and data.
Files for your own tools
The exports you need for your own software: PDF, CSV and GIS.
Uses: see, measure, monitor over time
Site mapping, development and restoration plans, environmental mapping, volume calculations: drone photogrammetry meets the needs of many professions.
- Quarriesstockpile volumes, remaining reserves, monitoring of extraction and restoration
- Construction sitescut and fill, excavated volumes, progress of works
- Land surveyorslarge-scale orthophotos and terrain models
- Architects and developersexisting conditions, relief, fitting a project into its setting
- Environmental consultancieshabitat mapping, slopes, monitoring a site over time
- Local authoritiesplanning, heritage, land management
Frequently asked questions
What is the difference between an orthophoto and an aerial photo?
An aerial photo is a perspective view: the scale varies with distance and relief, and buildings lean. An orthophoto assembles many rectified photos: its scale is the same everywhere, you measure distances and areas on it and overlay it on a plan.
DSM and DTM: what is the difference?
The digital surface model (DSM) describes everything the drone sees: ground, vegetation, buildings, machinery. The digital terrain model (DTM) describes the bare ground, once vegetation and objects have been removed through point classification.
How is a stockpile volume measured?
I draw the outline of the stockpile on the model, then compute the volume between the stockpile surface and a base surface beneath it. Repeating the survey tracks how stockpiles and extracted volumes change.
What resolution does a drone survey give?
It depends on the flying height and the camera: at 120 m, with the 1-inch, 20-megapixel sensor used for the survey shown here, each pixel of the orthophoto covers about 3.3 cm on the ground. Accuracy, on the other hand, comes from georeferencing: an RTK drone and control points measured with an RTK GNSS receiver on a tripod give centimetre-level positioning.
Do you need authorisation to fly a drone over a quarry or construction site?
European Regulation (EU) 2019/947 governs drone flights. Depending on the risk, a flight falls into the 'open' category, with strict limits (distance from people and residential areas…), or into the 'specific' category: the operator must then be declared to the national authority (the DGAC in France) and fly under a standard scenario such as STS-01, or with an authorisation. On sensitive and regulated sites, flights are carried out under protocol.
An orthophoto, a 3D model, a volume calculation?
Explore the solutions and the interactive demos on real surveys, or let's talk about your project.
Olivier Lattuga, trained in photography and then a graduate of the EHESS, has spent fifteen years working with technical imagery and land. Based in Lyon, he works throughout France.
UAS operator declared to the DGAC (French civil aviation authority) — European standard scenario STS-01 (Regulation (EU) 2019/947) — flights under protocol on sensitive and regulated sites.